-2.png?width=221&height=60&name=Navigo_Logo_High_Res%20(1)-2.png)
Overview
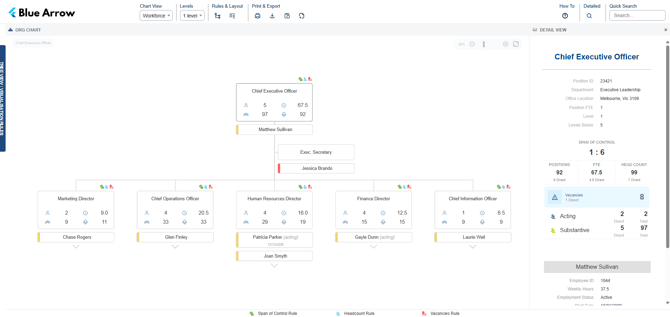
The Workforce Chart overlays key workforce metrics onto your org chart, showing direct and indirect headcount, FTE, vacancies, acting arrangements and span of control for each position. It also shows who is substantively in a role and who is acting, and surfaces key employee details including salary, employment status and reporting relationships.
It helps HR teams and managers quickly understand the shape of their workforce, spot structural issues and track vacancy exposure across the organisation, without needing to open individual records.
This chart is designed for users who need more than a standard org view. It is used by HR teams and authorised managers who require access to sensitive position and employee information, to support workforce planning, restructuring and reporting.
Objectives
- Give HR staff and managers a complete view of headcount, FTE and position occupancy across the organisation
- Clearly distinguish between substantive and acting occupants in each role
- Surface vacancy, acting and substantive occupancy data in a single view
- Highlight span of control and headcount outliers to support structural review
- Surface key remuneration and employment details for authorised users
Required fields
To get the most out of this chart, the following fields are generally recommended:
- Employee FTE
- Position FTE
- Employee Status
- Employee Type
- Start Date
- Job Grade
- Salary Information
- Date of Birth
- Weekly Hours
- Position/Employee End Date
Conditional Formats
The following display options can be toggled to customise what appears on the chart:
- Show Occupants - displays the name of the employee filling a position
- Show Position ID - displays the position ID field
- Show Employee ID - displays the employee ID field
- Show End Date - displays the end date of the occupant
- Show Only Vacancies - filters the chart to show unfilled positions only
Detail View
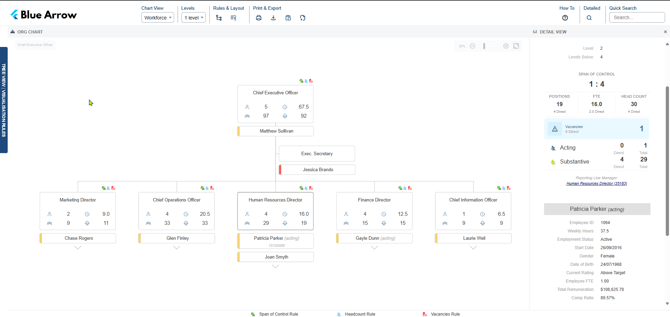
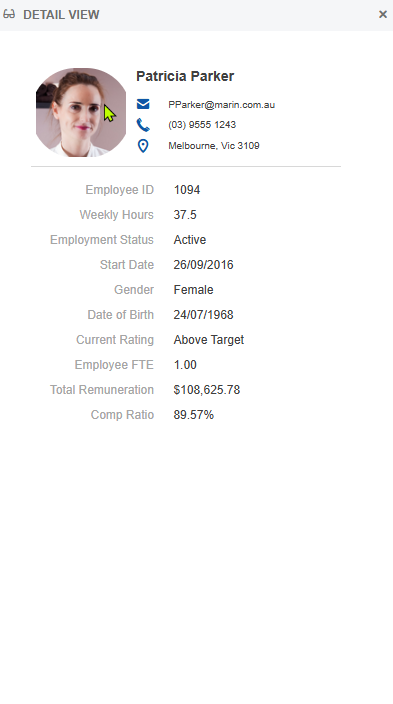
Selecting a position or person opens the Detail View, which presents position and employee data side by side:
- Position details — Position ID, Department, Office Location, Position FTE, Level and Levels Below, followed by Span of Control and the Positions, FTE and Head Count totals with their direct counts. Vacancies, Acting and Substantive counts are shown for both direct and total.
- Employee details — the occupant's photo and contact details, Employee ID, Weekly Hours, Employment Status, Start Date, Employee FTE and the remuneration and performance fields your organisation has chosen to map.
Legend
Each position card displays icons to indicate workforce rule triggers at a glance:
- Green person icon — Span of Control Rule
- Blue people icon — Headcount Rule
- Red person icon — Vacancies Rule
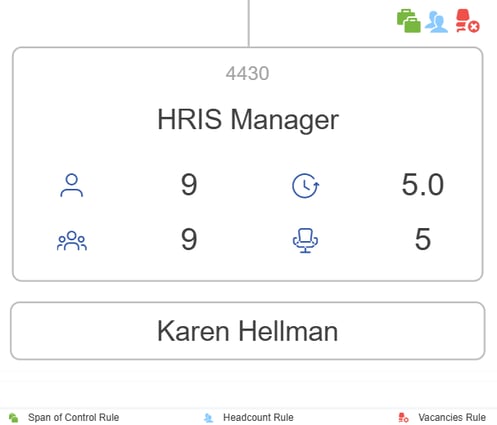
Slider controls allow you to set custom thresholds for Indirect Span of Control, Indirect Headcount and Indirect Vacancies, so the chart flags the positions that need attention. The relevant icon is displayed against the position if the highlight condition is true.
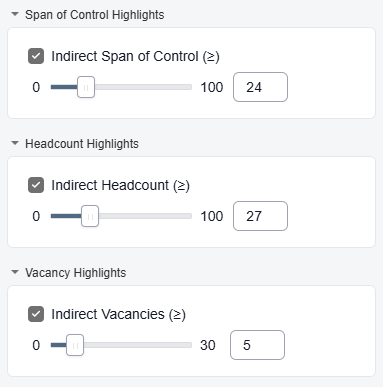
The criteria for this legend can be customised to reflect your organisation's specific workforce policies and thresholds.
Vacant positions
Vacant positions are surfaced directly in the chart and Detail View, showing both direct and total vacancy counts per position. Use the Show Only Vacancies conditional format to filter the chart down to unfilled roles only, which is useful for recruitment planning and reporting.
Formulas
The Workforce Chart supports the following calculated fields:
- Direct Reports
- Indirect Reports (Total)
- Total Reports
- Direct FTE
- Indirect FTE (Total)
- Direct Positions
- Indirect Positions (Total)
- Span of Control
- Vacancies (Direct and Total)
- Acting (Direct and Total)
- Substantive (Direct and Total)
- Levels Below
Security
This chart is intended for HR administrators and authorised managers only. It surfaces sensitive remuneration and personal data alongside position and structural data, so access is restricted to a specific user group to ensure it is only visible to the right people. During implementation, we will workshop your specific security requirements.
Mapped fields
The fields shown in this chart are fully customisable. If there's something your team needs to see (or doesn't), we can configure the chart to match - just let us know.